이전 강의는 파이썬 기본 문법이라 생략.
이번 강의는 파이썬으로 파일을 읽어오고 matplotlib 맛보기까지 진행한다.
1-1. 파일 열기
with 인덴트 안에서 파일 읽기가 가능하다. content에 파일 전체가 들어간다.
with open('filename.txt') as file:
    content = file.read()
다른 방법으로는
file = open('filename.txt')
content = file.read()
file.close() # 파일 닫기
with으로 불러오면 file.close를 실행하지 않아도 된다.
1-2. 파일을 한 줄씩 읽어오기
contents = []
with open('filename.txt') as file:
	for line in file:
    	contents.append(line)
파일 텍스트를 한 줄씩 읽어온다.
1-3. 쓰기 모드로 파일 불러오기
with open('filename.txt', 'w') as file:
	file.write('hello')
2. 튜플 자료형
리스트와 튜플 모두 순서가 있는 원소들의 집합이라는 점에서 동일하지만
튜플은 리스트와 다르게 수정이 불가능하다.
3. List Comprehension
리스트 안에 for문이다.
words = [
    'apple',
    'banana',
    'alpha',
    'bravo',
    'cherry',
    'charlie',
]

[word[0] for word in words] # words안에 있는 모든 단어의 앞글자만 출력

[word for word in words if word.startswith(prefix)] # 조건을 붙일 수도 있음
4. 정렬하기
파이썬에선 sorted라는 정렬함수가 존재한다. key에 함수를 넣으면 조건대로 정렬할 수 있다. default는 asc 오름차순이다.
sorted(list, key=조건함수, reverse=True) # reverse=True하면 내림차순 정렬
sorted(list, key=abs) # 절대값을 기준으로 정렬
튜플 역시 정렬 가능하다. 튜플의 경우 한 튜플안에 여러 개의 인자가 존재하므로 그 중 하나를 기준으로 잡아야 한다.
from operator import itemgetter
sorted(tuple, key=itemgetter(1)) # 1번째 요소로 오름차순 정렬
5. 그래프 만들기
matplotlib 모듈 사용
파이썬에서 그래프를 그릴 수 있게 하는 모듈로 설정에 따라 막대, 꺾은선 그래프를 모두 지원한다.
import matplotlib.pyplot as plt
import matplotlib.font_manager as fm

from elice_utils import EliceUtils
elice_utils = EliceUtils()

# (word, int)형의 튜플 리스트를 인풋으로 받는다.
def draw_frequency_graph(corpus):
    # 막대 그래프의 막대 위치를 결정하는 pos를 선언합니다.
    pos = range(len(corpus))

    # 튜플의 리스트인 corpus를 단어의 리스트 words와 빈도의 리스트 freqs로 분리합니다.
    words = [tup[0] for tup in corpus]
    freqs = [tup[1] for tup in corpus]

    # 한국어를 보기 좋게 표시할 수 있도록 폰트를 설정합니다.
    font = fm.FontProperties(fname='./NanumBarunGothic.ttf')

    # 막대의 높이가 빈도의 값이 되도록 설정합니다.
    plt.bar(pos, freqs, align='center')

    # 각 막대에 해당되는 단어를 입력합니다.
    plt.xticks(pos, words, rotation='vertical', fontproperties=font)

    # 그래프의 제목을 설정합니다.
    plt.title('단어 별 사용 빈도', fontproperties=font)

    # Y축에 설명을 추가합니다.
    plt.ylabel('빈도', fontproperties=font)

    # 단어가 잘리지 않도록 여백을 조정합니다.
    plt.tight_layout()

    # 그래프를 표시합니다.
    plt.savefig('graph.png')
    elice_utils.send_image('graph.png')
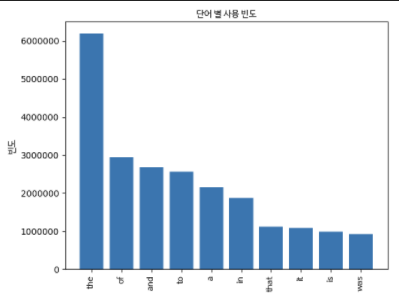
예제를 실행시키면

이렇게 막대 그래프가 나온다.
'Data Science > Data Science' 카테고리의 다른 글
| [Data Science] CSV 데이터 읽고 처리하기 (2) | 2021.01.19 |
|---|---|
| [Data Science] 데이터 형변환 (0) | 2021.01.17 |
| [Data Science] 파이썬 크롤링 - 워드 클라우드 만들기 (0) | 2021.01.12 |
| [Data Science] API 크롤링 (0) | 2021.01.07 |
| [Data Science] 파이썬 크롤링 2 (0) | 2021.01.07 |


댓글